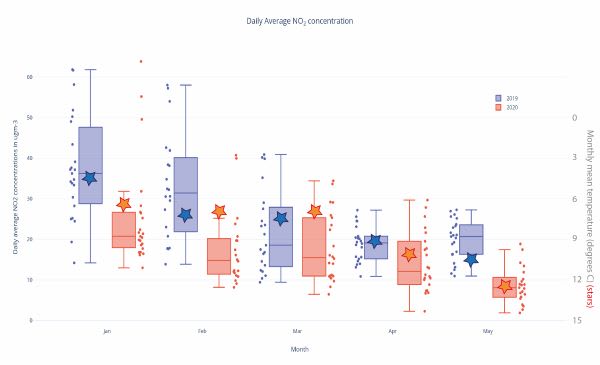
Over the course of the Summer Term, a group of twelve Year 10 and 12 pupils have been investigating changes to pollution levels in the UK due to COVID-19. Across the UK there is a network of over 1,500 air monitoring stations run by DEFRA that measure a range of different atmospheric pollutants such as Nitrogen Dioxide, Ozone and Sulfur Dioxide. These automatic stations record pollution level every hour and the data is freely available online.
As part of a competition run by the University of Bristol, pupils selected a location and pollutant of interest to investigate how levels have changed from 2019 to 2020 between January and May. As the global economy slower down in early 2020 there was a global drop of around 20% in CO2 emissions. Their investigations looked specifically at pollutants within the UK and they were able to pick out on fascinating tends. Not only were UK pollutant levels lower for 2020 in the UK they were also able to use hourly data to see changes in the time, and intensity, of rush hour traffic. As less people commuted, the evening rush hour shifted later and overall levels were lower.
Dealing with ‘big data’ is becoming increasingly important in our data driven society. It is impressive to see our pupils handling large data sets (over 6,000 points) of real world data to try make sense of what has happened during these extraordinary times.
Categories: Academic